
Featured Snippet
To evaluate AI model fairness, first define the use case and impacted groups, then audit your data, choose fairness metrics (like demographic parity or equalized odds), slice performance by sensitive attributes, compute metrics with a toolkit, interpret trade-offs with accuracy, mitigate issues, and continuously monitor and document results.
Introduction: Fairness is Not a Metric You “Turn On”
Most AI teams discover fairness the hard way: a model ships, someone slices results by gender or region, and suddenly it’s clear that “overall 92% accuracy” hides ugly gaps.
Fairness isn’t a single score or one checkbox in your MLOps pipeline. It’s a structured evaluation process that starts before training and continues in production. Frameworks like the NIST AI Risk Management Framework explicitly call out fairness as something you have to map, measure, and manage across the AI lifecycle, not just at model-selection time.
This article walks through a practical, step-by-step workflow for evaluating AI model fairness, using concepts from widely adopted toolkits like AI Fairness 360 and Fairlearn, plus concrete metrics and examples you can adapt to your stack. If you’re building governance into your AI systems, this fairness evaluation process is a core component—see our guide on Explainable AI vs AI Governance for how fairness fits into the larger picture.
Step 0: Get Clear on What “Fairness” Means for Your Use Case
Before touching code, you need to answer three questions:
What decision is the model influencing? Hiring screening, credit limits, fraud flags, medical risk scores, content moderation, etc.
Who can be harmed? Map out affected users and groups (e.g., age, gender, race, geography, disability status). Modern fairness guides are explicit that fairness is a socio-technical problem — it’s about people, institutions, and power, not just error rates.
What kind of unfairness would be worst here?
- Under-approving qualified people (false negatives)
- Over-flagging specific groups (false positives)
- Unequal access to beneficial outcomes
- Disparate error rates across groups
NIST’s AI Risk Management Framework calls this the “Map” phase: understanding context, potential harms, and relevant regulation before you evaluate or mitigate anything.
If you skip this step, you’ll end up optimizing fairness metrics that look good on paper but don’t match real-world risks.
Step 1: Define Sensitive Attributes and Fairness Goals
Now turn that context into something you can actually compute.
1.1 Choose sensitive attributes
Typical sensitive (or “protected”) attributes include:
- Sex / gender
- Race / ethnicity
- Age bands
- Disability status
- Location (country, region, postcode)
- Socioeconomic proxies (education level, income bracket)
You usually won’t be allowed to use all of these in the model, but you do want them for evaluation. Toolkits like Fairlearn and AIF360 treat these as “sensitive features” you pass alongside predictions.
1.2 Pick fairness notions that actually matter
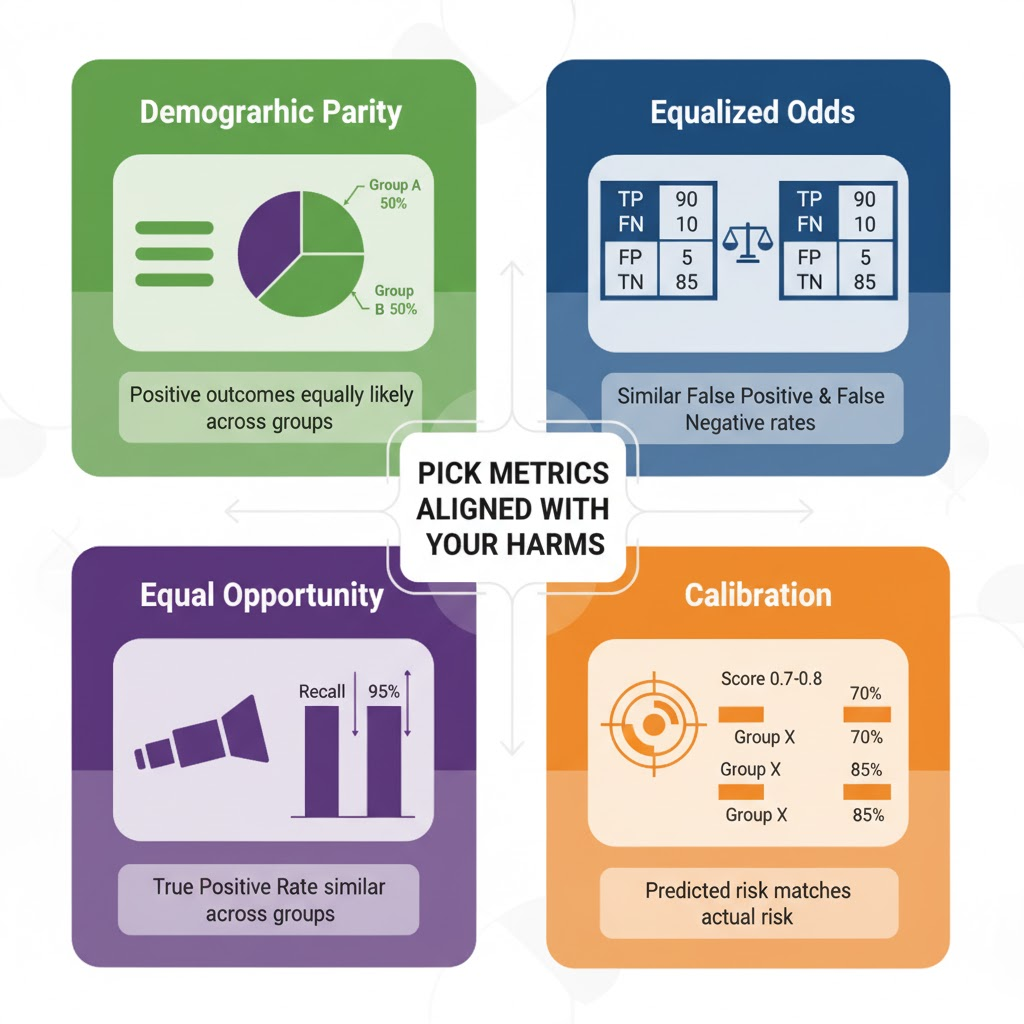
There are many formal definitions of fairness. The most common families:
Demographic (statistical) parity — Positive outcomes should be equally common across groups. Example: 30% of applicants get approved for a loan, regardless of gender.
Equalized odds / error-rate parity — False positive and false negative rates should be similar across groups. Example: A fraud model shouldn’t falsely flag transactions for one region much more often than another.
Equal opportunity — True positive rate (recall) should be similar across groups. Example: A cancer detection model should be equally sensitive for all demographic groups.
Calibration — For a given predicted risk score (e.g., 0.8), the actual observed risk is similar across groups.
Individual / counterfactual fairness — Similar individuals (or a person and their “counterfactual twin” with a different sensitive attribute) should receive similar predictions.
You cannot optimize all of these at once; there are formal impossibility results showing that many definitions are mutually incompatible. In practice, tie the choice to your harms:
- Loans / hiring: often prioritize demographic parity or disparate impact limits
- Medical or safety models: often prioritize equal opportunity or equalized odds (missing high-risk cases for one group is unacceptable)
- Risk scores: calibration across groups is critical
Write your fairness goal in a sentence:
“For this credit scoring model, we aim to keep loan approval rates for women and men within a 5 percentage-point range, while maintaining AUC ≥ 0.80.”
That one line will guide metric choices later.
Step 2: Audit the Data Before You Blame the Model
Most fairness issues start with the data, not the model.
A basic data fairness audit includes:
Representation check — How many samples per group? Are some groups severely under-represented (e.g., 4% of training rows)?
Label bias check — Who created the labels? Are they outcomes that themselves encode historic bias (e.g., prior arrests, loan defaults affected by systemic inequality)?
Feature leakage / proxies — Do non-sensitive features strongly predict sensitive attributes (postcode → race; device type → income)? This can reintroduce unfairness even if you drop sensitive columns from training.
You can start simple:
- Plot label distribution by group
- Plot key feature distributions by group
- Check missingness by group
Toolkits like AIF360 include convenience functions to explore dataset fairness — not just model fairness — for common benchmark datasets.
If the data is fundamentally biased in a way you can’t correct or contextualize, the honest answer may be: don’t deploy this model for this use case.
Step 3: Train a Baseline Model and Log Grouped Performance
Now train (or take your existing) model as usual, but plan for group analysis from the start:
- Keep a clean evaluation dataset with sensitive attributes attached
- Save predictions, true labels, and sensitive attributes together in a table for analysis
| sample_id | y_true | y_pred | score | gender | age_band | region |
|---|---|---|---|---|---|---|
| 1001 | 1 | 1 | 0.92 | M | 30-40 | US-CA |
| 1002 | 0 | 1 | 0.78 | F | 25-35 | US-NY |
| 1003 | 1 | 0 | 0.45 | M | 45-55 | EU-DE |
This “scored dataset” is the raw material for fairness metrics.
Most fairness libraries assume you already have either:
- Binary predictions (0/1), or
- Continuous scores plus a threshold to convert to 0/1
Make sure you lock in the threshold you’d actually use in production (or evaluate multiple thresholds).
Step 4: Compute Fairness Metrics by Group
This is where formal fairness metrics come in.
4.1 Use a dedicated toolkit
Common choices:
AI Fairness 360 (AIF360) — IBM’s toolkit with a large catalog of fairness metrics and mitigation algorithms.
Fairlearn — Microsoft-originated toolkit focusing on group fairness, with a rich user guide and visualization dashboard.
Fiddler AI — Platform tool for real-time fairness monitoring with intersectional fairness metrics in production.
Google Vertex AI Fairness Evaluation — Built-in bias detection and fairness metrics for cloud-based models.
Cloud ML fairness APIs — Integrated with model training/serving in Azure and other cloud providers.
These libraries compute both standard ML metrics (accuracy, precision, recall, AUC) and fairness metrics broken down by group.
4.2 Core metrics to look at
Typical group-based fairness metrics include:
Positive prediction rate (PPR) — Fraction of positive predictions per group → feeds into demographic parity.
True positive rate (TPR) / recall parity — Measures equal opportunity: how many real positives the model catches per group.
False positive rate (FPR) parity — Part of equalized odds: how often each group is incorrectly flagged.
Disparate impact ratio — Ratio of PPR for a protected group vs. reference group. In many regulatory contexts, <0.8 is a red flag (“80% rule”).
Calibration by group — For a given score bucket (e.g., 0.7–0.8), compare actual event rates across groups.
A good workflow:
- Pick 2–3 fairness metrics aligned with your harms
- Compute them per group, plus the difference from the best group and ratios between groups
- Visualize them (bar charts by group) – most toolkits support this directly
Many practitioners recommend using multiple metrics simultaneously, not just one, because they capture different fairness dimensions.
4.3 Consider intersectional fairness
Evaluate metrics not just by gender OR race, but by gender AND race combinations (e.g., Black women, Asian men, Latinx men). Tools like Fiddler and AIF360 support intersectional fairness analysis. Single-attribute analysis can miss group-specific harms—for example, Black women may experience different disparity patterns than women or Black people analyzed separately.
4.4 Code Example: Computing Fairness Metrics with Fairlearn
Python
import pandas as pd
from fairlearn.metrics import demographic_parity_difference, equalized_odds_difference
from fairlearn.postprocessing import ThresholdOptimizer
# Assume you have: y_true, y_pred, y_score, sensitive_features (gender, race, etc.)
# y_score: continuous predictions [0, 1]
# sensitive_features: pandas Series with group labels
# Compute demographic parity difference
dp_diff = demographic_parity_difference(
y_true, y_pred,
sensitive_features=sensitive_features
)
print(f"Demographic Parity Difference: {dp_diff:.3f}")
# Compute equalized odds difference
eo_diff = equalized_odds_difference(
y_true, y_pred,
sensitive_features=sensitive_features
)
print(f"Equalized Odds Difference: {eo_diff:.3f}")
# Visualize trade-offs between accuracy and fairness
from fairlearn.plotting import plot_model_performance_glance
plot_model_performance_glance(
unmitigated_predictor=model,
X_test=X_test,
y_true=y_test,
sensitive_features=sensitive_features
)
Step 5: Interpret Fairness vs. Accuracy Trade-offs
You’ll rarely see a clean story like “everything is fair and accurate.” Instead you’ll get something like:
Overall AUC: 0.89
Male group:
- Approval rate: 35%
- TPR: 0.92
Female group:
- Approval rate: 22%
- TPR: 0.83
That’s a problem even if both groups have “good” AUC. Here’s how to reason about it:
Check statistical significance
Are group differences large enough and sample sizes big enough to matter? With small sample sizes, group differences might be noise, not bias. Use confidence intervals: if a 5% approval difference has a 95% CI of ±8%, it’s inconclusive. Fairlearn and other toolkits include statistical tests — use them to separate signal from noise and avoid acting on spurious differences.
Interpret in business / ethical terms
“Qualified women are 9 percentage points less likely to be correctly approved” is a clearer statement than “TPR difference = 0.09.”
Look for root causes
- Is one group under-represented?
- Are labels noisier for that group?
- Is a single feature driving most of the disparity?
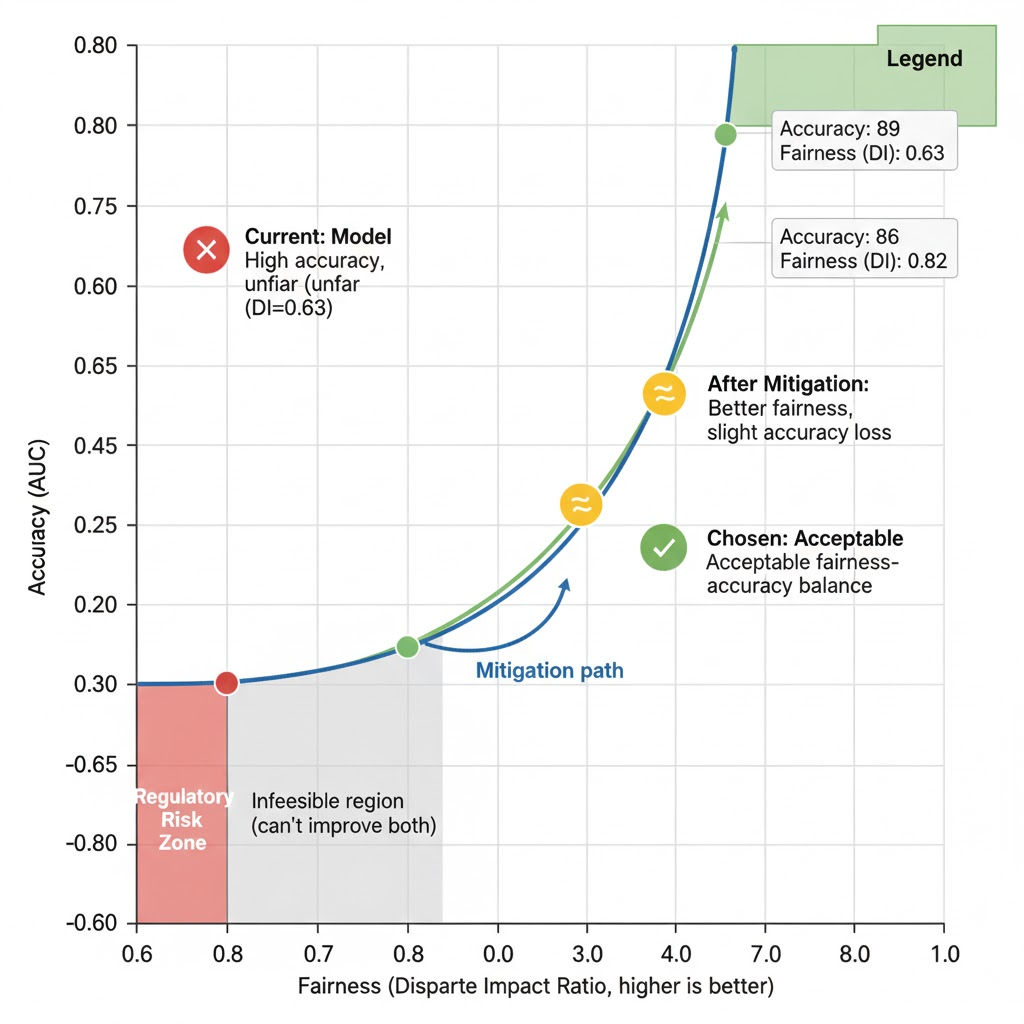
Fairness-oriented dashboards (e.g., Fairlearn’s) are designed to show these trade-offs, often plotting model performance vs. disparity so teams can explicitly choose a point on the curve.
Document your findings plainly:
“At current settings, the model shows substantial demographic disparity in approvals (22% vs 35%), with a disparate impact ratio of 0.63. This is below our internal threshold (0.8) and would likely be considered unfair.”
Step 6: Mitigate Unfairness (Pre-, In-, and Post-Processing)
Evaluation and mitigation should be tightly linked. Toolkits like AIF360 and Fairlearn include algorithms at multiple stages of the ML pipeline.
6.1 Pre-processing (fix the data)
Re-weighting or re-sampling — Give more weight to under-represented groups or re-sample to balance.
Transform features — Remove or modify biased features; reduce the influence of strong proxies.
6.2 In-processing (change training)
Fairness-constrained optimization — Train models subject to constraints like “FPR difference ≤ X.”
Adversarial debiasing — Train a secondary model to predict sensitive attributes from predictions and penalize it for succeeding (making predictions less informative about the attribute).
6.3 Post-processing (adjust outputs)
Group-specific thresholds — Use different decision thresholds per group to equalize a fairness metric (e.g., equal opportunity).
Score calibration by group — Calibrate probabilities separately to fix group-wise miscalibration.
6.4 Code Example: Group-Specific Thresholds with Fairlearn
python
from fairlearn.postprocessing import ThresholdOptimizer
# Optimize thresholds to equalize opportunity across groups
threshold_optimizer = ThresholdOptimizer(
estimator=model,
constraints='equalized_odds',
grid_size=1000,
prefit=True
)
# Fit on training data
threshold_optimizer.fit(X_train, y_train, sensitive_features=groups_train)
# Apply optimized thresholds
y_pred_mitigated = threshold_optimizer.predict(
X_test,
sensitive_features=groups_test
)
# Re-compute fairness metrics
print("Post-mitigation fairness metrics:")
print(demographic_parity_difference(y_true, y_pred_mitigated, sensitive_features=groups_test))
Each mitigation step should be followed by re-evaluation:
- Re-compute fairness metrics
- Re-compute overall performance (AUC, precision/recall)
- Decide whether the trade-off is acceptable and documented
Don’t oversell what mitigation can do; as Fairlearn’s authors emphasize, these are tools inside a broader socio-technical process, not magic fairness switches.
Step 7: Document, Monitor, and Align with Governance
A fair model at launch can drift into unfairness as data or user behavior changes. Modern frameworks stress ongoing measurement and governance, not one-off audits.
7.1 Document your fairness evaluation
At minimum, capture:
- Use case and decision context
- Sensitive attributes considered
- Fairness definitions and metrics used
- Datasets (with date ranges and sources)
- Evaluation results by group
- Mitigation steps taken and known limitations
- Who signed off (and when)
Many teams wrap this into internal model cards or risk registers. See our guide on AI Governance for how to integrate fairness documentation into your larger governance framework.
7.2 Set monitoring thresholds
In production:
- Periodically recompute fairness metrics on fresh data (e.g., weekly or monthly)
- Set alert thresholds, such as:
- Disparate impact ratio < 0.8
- TPR difference > 0.05 for any group
- Feed alerts into your incident / governance process
NIST’s “Measure” and “Manage” functions explicitly include monitoring fairness impacts over time, not just at deployment.

Comparing Tooling Options for Fairness Evaluation
You’ll often combine multiple tools. Here’s a high-level comparison:
| Tool / Framework | Type | Strengths | Typical Use | Latest (2025) |
|---|---|---|---|---|
| AIF360 | Open-source lib | Many metrics + pre/in/post-processing algos | Python / R workflows | Intersectional fairness support |
| Fairlearn | Open-source lib | Strong docs, dashboard, parity-based methods | Python + Jupyter, Azure ML | Enhanced statistical testing |
| Fiddler AI | Platform tool | Real-time monitoring, intersectional fairness | Production monitoring | New intersectional metrics |
| Google Vertex AI | Platform tool | Built-in bias detection, integrated pipeline | Google Cloud users | Improved fairness evaluation APIs |
| Cloud ML fairness APIs | Platform tools | Integrated with model training/serving | Azure / AWS / Google Cloud | Expanding coverage |
Pick based on where your models live today and how much flexibility you need.

Who Should Be Involved?
Real fairness evaluation is cross-functional:
- Data scientists / ML engineers run metrics and mitigation
- Domain experts help interpret harms (e.g., clinicians, loan officers)
- Legal / compliance / risk ensure regulatory requirements are met
- Product and UX consider alternatives beyond “just use a model”
If only one person “owns” fairness, you’ll miss important angles.
Conclusion: Fairness is a Process, Not a One-Time Score
Evaluating AI model fairness isn’t about finding a single “fairness score” that makes everyone comfortable. It’s a step-by-step process:
- Map context, harms, and sensitive attributes
- Audit data for representation and label bias
- Select fairness definitions that match real-world stakes
- Compute group-wise metrics with an appropriate toolkit
- Interpret trade-offs transparently
- Mitigate, re-evaluate, and be honest about limitations
- Document and monitor as part of your governance program
If you follow this loop, you’ll move beyond “is our model biased?” to a more realistic question: “Given our context and constraints, are we managing fairness risks responsibly — and can we show our work?”
FAQ: Evaluating AI Model Fairness
1. Do I always need sensitive attributes to evaluate fairness?
Yes, for group fairness you need some notion of group membership (even if it’s limited, like age bands or regions). If you legally can’t store sensitive data, consider proxy groups, external audits with synthetic or partner data, or focusing on other governance controls.
2. How often should I re-evaluate fairness?
At minimum, whenever you retrain or change thresholds. For high-impact systems (credit, hiring, health, safety), treat fairness like performance monitoring: re-compute metrics regularly on fresh data and alert on drift in disparities.
3. What if fairness metrics conflict with overall accuracy?
That’s normal. Some fairness constraints will reduce headline accuracy. The key is to make trade-offs explicit, document them, and ensure they align with your risk appetite, regulation, and ethical commitments, rather than silently optimizing only for accuracy.
4. Are open-source toolkits enough for compliance?
Toolkits like AIF360 and Fairlearn are technical enablers, not compliance guarantees. They help you measure and mitigate, but you still need governance: policies, human review, documentation, and alignment with frameworks like NIST’s AI Risk Management Framework and any sector-specific rules.
5. Can I prove my model is “fair”?
Not in an absolute sense. You can show that, under clearly stated assumptions and definitions, your model meets certain fairness criteria and that you’ve taken reasonable steps to detect, mitigate, and monitor harms. That transparency and process is what regulators, auditors, and users will expect.
Sources & References
Frameworks & Standards
- NIST AI Risk Management Framework – U.S. National Institute of Standards and Technology
Fairness Toolkits & Research
- AI Fairness 360 (AIF360) – IBM Open Source Toolkit
- Fairlearn – Microsoft Toolkit for Group Fairness
- Fairlearn GitHub Repository – Source code and documentation
Cloud Platforms & Tools
- Google Vertex AI Fairness Evaluation – Built-in bias detection and fairness metrics
- IBM Watson OpenScale – Enterprise AI governance platform
Related MyUndoAI Guides
- Explainable AI vs AI Governance for Beginners – Understanding governance frameworks
- Best Free AI Tools in 2025 – Including fairness toolkits
- AI vs Machine Learning vs Deep Learning Made Easy – Foundation concepts for fairness evaluation