Featured Snippet
AI model monitoring data pipelines ensures data quality, completeness, and consistency at each stage before it reaches your model. It detects data drift, missing values, schema changes, and processing failures preventing silent model degradation and production incidents.
Introduction
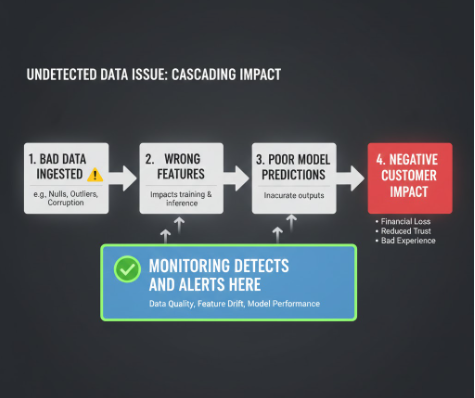
Production machine learning failures rarely originate in the model itself. More often, they stem from upstream data pipeline problems: missing features, corrupted records, schema drift, or delayed data arrival. A model trained on clean, representative data will fail silently when fed degraded data in production and you won't know until accuracy metrics collapse.
This is why monitoring data pipelines feeding AI models has become non-negotiable for any organization running models in production. Unlike traditional software monitoring (which tracks uptime and latency), data pipeline monitoring focuses on the quality and integrity of data itself. It answers critical questions: Is the data schema correct? Are features within expected ranges? Is the data arriving on time? Are upstream data sources still valid?
The consequences of ignoring data pipeline health are severe: misaligned predictions, regulatory violations (in finance or healthcare), eroded user trust, and emergency incident response. Organizations that treat data pipeline monitoring as an afterthought discover this too late often during a production outage.
This article explains what AI model monitoring data pipelines means, why it matters, core monitoring techniques, common pitfalls, and practical implementation strategies to prevent data-driven model failures.

What AI Model Monitoring Data Pipelines Actually Means
AI model monitoring data pipelines refers to the continuous observation and validation of data flows from raw sources through transformation, enrichment, and feature engineering stages to ensure data quality before it reaches a production model.
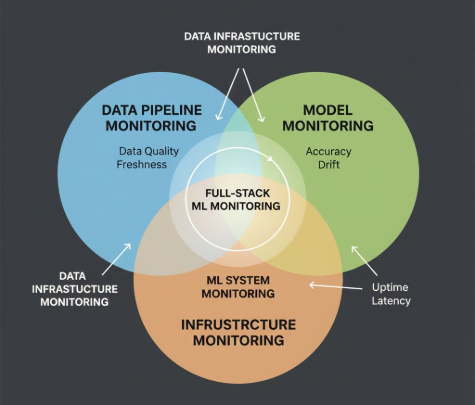
It differs from model monitoring (which tracks prediction quality) and infrastructure monitoring (which tracks system uptime). Data pipeline monitoring is about data integrity and completeness.
How it works:
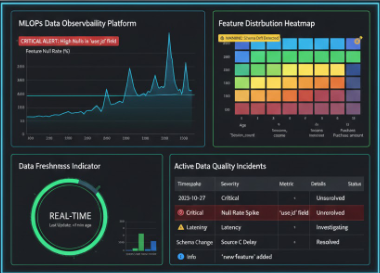
At each stage of a data pipeline, monitoring systems collect metadata: row counts, null percentages, value distributions, schema compliance, and data freshness. These signals are compared against baselines or thresholds. When anomalies are detected (e.g., a feature that should be numeric contains text), alerts trigger before bad data corrupts model predictions.
Example: A recommendation engine's data pipeline ingests user behaviour from three sources. A monitoring system tracks that Source A should deliver 10,000 events/hour; if it drops to 1,000, an alert fires within seconds. Simultaneously, it validates that the user_id field contains only valid integer IDs catching a schema drift before corrupt records reach the model.
Why It Matters
Real Business Value:
- Prevents Silent Failures — Models don't error; they degrade. A model trained on balanced data will still run when fed imbalanced data producing biased predictions no one notices until customers complain or audits flag it. Monitoring catches this immediately.
- Reduces Incident Response Time — When a model's accuracy drops from 92% to 78%, is it the model or the data? Without pipeline monitoring, you're debugging blind. With it, you know within minutes: "Upstream source X went offline at 3 AM; 40% of features are missing."
- Protects Compliance and Trust — In regulated industries (finance, healthcare, insurance), data quality failures can trigger compliance violations. Monitoring provides an audit trail proving data was validated before predictions.
- Optimizes Cost — Bad data flowing through expensive ML inference wastes compute and cloud spend. Early detection prevents resource wastage.
Core Capabilities / Components
Data pipeline monitoring systems typically include these components:
1. Schema Validation
What it is: Ensures data structure (column names, data types, field order) remains consistent.
Why it matters: A schema change upstream breaks feature engineering code and corrupts model inputs.
Micro-example: Your data source changes from user_age (integer) to age_group (categorical). Without schema validation, your model's feature that expects age > 18 will error silently or produce nonsense values.
2. Statistical Profiling & Drift Detection
What it is: Tracks distributions of numeric and categorical features, comparing production data to training baselines.
Why it matters: Data drift (shift in feature distributions) is the primary cause of model decay. A model trained on winter weather patterns will fail in summer without drift detection.
Micro-example: Your churn model was trained when 15% of users had premium subscriptions. In production, this shifted to 35%. Monitoring flags this as drift; without it, your model silently under-predicts churn for the new cohort.
3. Completeness & Null Checks
What it is: Monitors row counts, null rates, and missing mandatory fields.
Why it matters: Missing data breaks feature engineering pipelines and introduces bias if nulls are non-random.
Micro-example: A critical feature supplier occasionally drops events (known bug in their logging). Monitoring detects when your data table is missing 5,000 expected rows and alerts before your model trains on incomplete data.
4. Freshness & Latency Monitoring
What it is: Tracks how current the data is and whether it arrives within expected time windows.
Why it matters: A real-time recommendation engine relying on stale user behavior makes poor suggestions. Batch models expecting daily updates will fail if data arrives 12 hours late.
Micro-example: A credit risk model expects application data every morning by 6 AM. If the data warehouse ETL fails and data arrives at 2 PM, the model either waits (delaying decisions) or runs on stale data (introducing risk).
5. Anomaly Detection
What it is: Uses statistical or ML-based rules to flag unexpected values or patterns.
Why it matters: Catches data corruption, sensor errors, or unexpected business events before they reach the model.
Micro-example: A fraud detection model's input includes transaction amounts. Normally, 99.5% of transactions are under $5,000. An anomaly detector flags a sudden spike in $50,000+ transactions, which could indicate a data source error or genuine fraud event the model should handle cautiously.
6. Lineage & Dependency Tracking
What it is: Maps which models depend on which data sources and transformations.
Why it matters: When a data source fails, you instantly know which models are affected and can trigger failover or alerting.
Micro-example: Your supply chain optimization model depends on three vendor APIs. When one goes down, lineage tracking immediately shows you which features are missing, and you can either wait or switch to a fallback model.
Limitations, Risks & Trade-Offs
1. False Positives & Alert Fatigue
Overly sensitive thresholds trigger hundreds of alerts per day. Teams tune alerts to "high severity only," missing real issues. Mitigation: Baseline thresholds on historical data; use contextual rules (e.g., "alert only if drift and model accuracy drops").
2. Blind Spots in Validation Logic
Monitoring systems validate what you tell them to. Subtle data quality issues—like legitimate business changes misidentified as anomalies—slip through. Example: A seasonal product's sales spike legitimately changes feature distributions; a static threshold would flag this as drift.
3. Computational Overhead
Profiling high-volume data pipelines (billions of rows/day) requires significant compute. Sampling introduces gaps. Full profiling can add 20-30% latency to pipeline execution.
4. Delayed Detection
Batch monitoring (checking data daily) misses intraday issues. Real-time monitoring is expensive and complex. Trade-off: Most teams monitor every N hours, accepting a window of risk.
5. Integration Complexity
Monitoring systems must integrate with data warehouses, ML platforms, and incident management tools. Building custom pipelines is time-consuming; third-party tools add vendor lock-in and cost.
6. Root Cause Attribution
When monitoring detects an issue, determining the root cause (is it a source system error? A transformation bug? Expected behaviour?) requires investigation. Monitoring flags the problem; it doesn't always explain it.
How It Compares
| Aspect | Data Pipeline Monitoring | Model Monitoring | Infrastructure Monitoring |
|---|---|---|---|
| What it tracks | Data quality, schema, distributions, freshness | Prediction accuracy, drift, model performance | Server uptime, latency, memory, CPU |
| Primary concern | Data integrity and consistency | Model correctness and performance | System reliability |
| Alert on | Missing fields, anomalies, schema changes | Accuracy drop, prediction distribution shift | Downtime, high latency |
| Typical tools | Great Expectations, Evidently, Soda, custom scripts | Evidently, Fiddler, Arthur, custom dashboards | Datadog, Prometheus, New Relic |
| Skill required | Data engineering + statistics | ML + statistics | DevOps + systems knowledge |
| Frequency | Continuous to hourly | Hourly to daily | Real-time |
| Strength | Catches upstream issues early | Detects model-specific degradation | Instant outage alerts |
| Weakness | Can't validate correctness of transformations | Requires labeled ground truth | Doesn't address data quality |
Key takeaway: All three are necessary. Infrastructure monitoring catches system failures. Model monitoring catches model decay. Data pipeline monitoring catches the root cause of most model failures.
Pricing & Value
Data pipeline monitoring costs vary by approach:
Open-source (Great Expectations, custom scripts):
- $0 software cost; requires 2-4 engineer-weeks to build, integrate, and maintain
- Total cost: ~$20K-40K (engineer time) + cloud infrastructure for running checks
Mid-market SaaS (Soda, Evidently):
- $5K-30K/year depending on data volume and team size
- Includes dashboards, alerting, integration with ML platforms
- Requires 1-2 weeks of implementation
Enterprise SaaS (Fiddler, Arthur, Collibra):
- $50K-500K+/year, often bundled with model monitoring and governance
- Includes advanced lineage, compliance reporting, automated remediation
- 4-12 week implementation
Cost drivers:
- Data volume (size of pipeline and frequency of checks)
- Monitoring frequency (real-time vs. hourly vs. daily)
- Breadth of validation (schema only vs. schema + statistics + anomalies)
- Integration complexity (number of data sources and downstream systems)
Value calculation: If a 48-hour undetected data quality issue costs your organization $100K in mistaken decisions, preventing 2 such incidents per year pays for $200K in monitoring tooling.
Who Should Use This (and Who Shouldn't)
Ideal Users:
- Teams with ML models in production (not experimentation)
- Organizations with high-volume, complex data pipelines (10+ transformations)
- Industries with compliance requirements (finance, healthcare, insurance)
- Companies where model failures have direct business impact (revenue, trust, legal)
- Teams with dedicated data engineering or MLOps infrastructure
Why It's Worth It:
If your model's input data comes from external sources, third-party APIs, or complex transformations, data pipeline monitoring is essential. If data quality issues have cost you incidents or customer trust, it's urgent.
Not a Fit If:
- Your model trains and runs on static, locally-verified datasets (rare)
- You have a single, simple data transformation with no external dependencies
- Your model failures would have zero business impact (educational use only)
- Your team lacks the engineering capacity to implement and maintain monitoring
- Data quality issues occur so rarely that monitoring ROI is negative
Practical Implementation Tips
1. Start with Critical Paths
Don't monitor every field in every table. Identify the 5-10 data sources and features that directly feed production models. Monitor those first. Expand once the system stabilizes.
2. Baseline on Historical Data
Before writing alert thresholds, compute statistics on months of production data. Use percentiles (e.g., "null rate is normally 0-2%, alert if > 5%") rather than hardcoded values.
3. Build Alerting in Layers
- Level 1: Hard stops (schema mismatch, critical nulls) — block pipeline execution
- Level 2: Warnings (drift detected, minor anomalies) — log and proceed, notify humans
- Level 3: Informational (cumulative metrics) — dashboards only
4. Integrate with Incident Management
Monitoring alerts are useless if no one sees them. Route alerts to Slack, PagerDuty, or Jira so teams respond within minutes. Include context: "Feature X is missing 30% of expected rows since 2 PM; last seen working at 1:50 PM."
5. Version Your Validation Rules
Treat monitoring rules (schemas, thresholds, anomaly detectors) as code. Version them in Git. When you change a model's features or rebaseline thresholds, version the change. This enables rollback if a rule becomes too noisy.
6. Distinguish Signal from Noise
Legitimate business events (seasonal peaks, new product launches, policy changes) shift data distributions. Monitoring systems should have a way to mark these as expected (e.g., "known surge campaign Dec 15-20"). Without this, you'll tune monitoring to ignore real signals.
7. Automate Remediation Where Possible
For certain failures, automate response: If upstream source X is down, automatically route traffic to fallback source Y. If a transformation produces nulls, trigger a data quality ETL job. This reduces MTTR (mean time to recovery) from hours to minutes.
8. Audit Monitoring Itself
Periodically verify that your monitoring system is working. Check: "Did monitoring catch the last three production data issues?" If not, update your rules. Monitoring that fails silently is worse than no monitoring.
Conclusion
AI model monitoring data pipelines is the unglamorous but critical foundation of production ML. Models don't fail in the lab, they fail in production when fed unexpected data. By continuously validating data quality, schema integrity, and freshness before it reaches your model, you prevent silent degradation, reduce incident response time, and protect your organization's trust in AI systems.
The best approach balances automation with human judgment. Automate validation of rule-based checks (schema, completeness, basic statistics). Alert humans to anomalies and drift that require investigation. Over time, your monitoring system becomes a map of what healthy data looks like and an early warning system for when things go wrong.
Implementing data pipeline monitoring requires upfront effort: choosing tools, baselining thresholds, integrating with incident management, and training teams. But for any organization running models in production, especially in regulated industries or high-stakes domains, it's not optional.
Good fit if: Your organization has complex data pipelines feeding production models, data issues have caused incidents before, or you're building ML infrastructure that must be reliable.
Not a fit if: Your models train on static datasets, you lack engineering capacity, or model failures have zero business impact.
FAQ
Q: How often should I monitor my data pipelines?
A: Real-time or near-real-time (every 5-15 minutes) for mission-critical models; hourly for daily-updated models; daily for batch processes. Start with hourly monitoring and adjust based on incident history.
Q: What's the difference between data pipeline monitoring and data quality?
A: Data quality is a state (is this dataset good?). Pipeline monitoring is continuous observation of quality as data flows. Quality checks are point-in-time; monitoring is ongoing.
Q: Can I use the same monitoring for development and production?
A: No. Production monitoring should be stricter (lower tolerance for anomalies) and faster (real-time alerting). Development can tolerate more noise and delayed alerts. Separate monitoring rules per environment.
Q: What's the most common reason data pipeline monitoring fails?
A: Alert fatigue. Teams set thresholds too tight, get thousands of alerts daily, tune them to silence, and miss real issues. Start conservative; only add rules for signals you've actually seen cause incidents.
Q: Do I need a dedicated tool, or can I build monitoring with Python scripts?
A: Both work. Python scripts (using Pandas, custom logic) are free but require maintenance. Dedicated tools (Soda, Great Expectations) are faster to implement and include dashboards. Choose based on team skill and scale.